MLflow in Production: Model Tracking and Deployment on Databricks
MLflow in Production is basically the split between a model that looks great in a notebook and one that actually survives Monday morning, you know.
At first, everybody cheers when the model hits 96% accuracy; suddenly there are screenshots everywhere, dashboards go green. Someone says, “We’re ready for production,” as if that’s the finish line. Then, you blink and reality shows up. The data shifts, a new release gets rolled out, and somehow nobody can even recall which experiment was behind that best result. The performance starts dropping in a quiet way, predictions turn a bit inconsistent, and the team ends up spending more time chasing “the right” version than improving the system itself.
The kind of funny part is that most of the time the model wasn’t even the issue. It’s what happens around it, after training ends, that turns into trouble.
Why MLflow in Production Changes Everything?
That’s the point where MLflow in Production changes the whole situation. Rather than treating machine learning like a bunch of disconnected projects, it turns it into a real setup where every run, every experiment, every model version, and every deployment has a traceable history. Nothing disappears, and nothing depends on someone’s memory or on that one notebook buried somewhere.
When you combine MLflow with Databricks, it gets even more interesting. Experiment tracking, model version control, deployment, and MLflow tracing all live inside one ecosystem built for production work, not just prototypes. If you’ve ever asked yourself why some teams ship models every week while others take months to figure out which one is currently live, you’re about to get the answer.
Building the model is fun. Keeping it dependable after the hundredth deployment, that’s where the real engineering starts, even if nobody claps for it.
What Is MLflow and Why Is It Important for Production ML?
MLflow is an open-source platform that manages the whole machine learning life cycle, keeping track of experiments, helping package models, and orchestrating releases across different environments. Think of it like version control plus CI/CD, but tailored for machine learning, where each model update, parameter set, and performance signal gets logged so you can search results later.
The problem it fixes feels pretty concrete. About 63 percent of ML models never really make it to production, and a lot of those breakdowns trace back to messy experiment tracking, inconsistent model packaging, or deployment friction that just slows everything down. Without MLflow, teams end up doing experiments manually; models sit in scattered folders, and dependencies get recreated by hand whenever a model moves from dev into production. It becomes tedious and error-prone, almost by design.
Also, organizations with mature model governance and structured MLflow or equivalent MLOps platform strategies deploy models five times faster while seeing around 90 percent fewer integration failures. MLflow is basically the underlying layer that makes that governance achievable at scale, not just on paper.
Understanding the Core Components of MLflow
MLflow has four core components, each one tackling a particular production bottleneck in its own way.
Tracking logs parameters, metrics, and artifacts for every experiment run. When your team spins up 200 hyperparameter combinations at the same time, Tracking stores everything in one centralized repo where you can later line up model A (accuracy 0.94, latency 120ms) versus model B (accuracy 0.918, latency 45ms) without spending hours digging through random notebooks or that late-night Slack thread where nobody can find the right numbers.
Projects packages code and dependencies into something reproducible and executable. A Project bundles your training script along with a conda.yaml that lists libraries and versions, plus an MLproject configuration file, so another teammate running the same thing months down the road sees identical results. You don’t get that annoying “it works on my machine” situation anymore.
Models standardize how models are packaged and shipped. MLflow handles scikit-learn, TensorFlow, PyTorch, XGBoost, and even custom Python models, with each one coming with helpful metadata, clear input/output schemas, and dependency information. Deployment tooling basically knows what it’s installing without having to guess.
Registry acts as a central repository for model versions, staging, and promotion. Models travel from Development to Staging to Production with approval gates along the way, and rollback features can kick in automatically when needed. You can also audit what model is currently live, who okayed it, and at what time, which is invaluable when someone asks “who changed this?”
Why Use MLflow with Databricks?
Databricks and MLflow are deeply integrated. Databricks is built on Apache Spark and includes Databricks Repos for Git integration, Databricks Workflows for orchestration, and Databricks Model Serving as the inference layer. MLflow runs natively on Databricks, so you don’t really need extra setup.
This integration wipes out friction in ways that matter. A data engineer trains a model in Databricks using PySpark and logs it to MLflow with one command, and a DevOps engineer can deploy it to Databricks Model Serving the very same day. There’s no API bridging, no manual Docker configuration, no credential management hopping across different platforms.
In our experience across 90+ enterprise AI deployments, MLflow on Databricks cuts the whole model-to-production timeline from 6 to 8 weeks down to about 2 to 3 weeks. The reason is straightforward: fewer context switches between tools means work simply moves forward. If you’re evaluating MLflow as part of a broader guide to machine learning, this integration advantage becomes even clearer.
Setting Up MLflow on Databricks
MLflow is already basically there on Databricks clusters, requiring no real extra deployment work. When your cluster is up, you log in to Databricks, open a notebook, and just import MLflow like this:
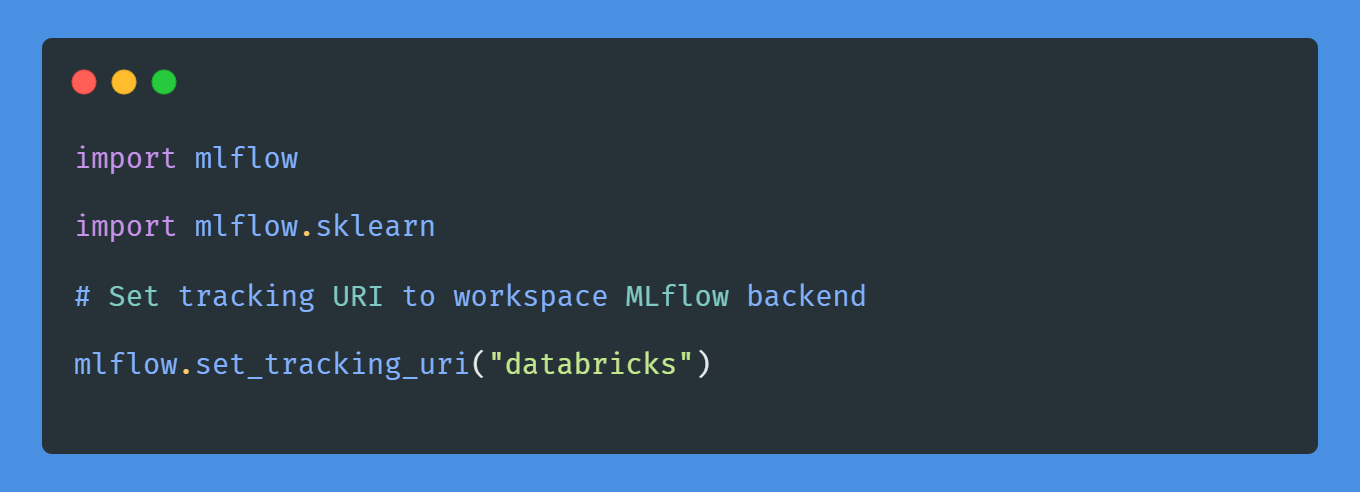
Done. Every experiment you run gets captured automatically by your Databricks workspace MLflow backend, and you can view it in the Databricks UI pretty easily.
For teams running MLflow outside Databricks, whether in on-premises environments, AWS SageMaker, or Azure ML, you typically need a remote backend. This means spinning up MLflow Server on an EC2 box or in a container, with PostgreSQL for tracking data and S3 storing the artifact files. The setup usually takes 2 to 3 hours, often with Terraform. After it’s configured, your training code reports to that same backend no matter where you execute it: locally, on cloud compute, or inside CI/CD pipelines.
How to Track Machine Learning Experiments with MLflow?
Experiment tracking is where most ML teams really stumble. Usually they just keep spinning model iterations without writing down what changed or why, so three months later nobody can say which hyperparameter set ended up with the best outcome. It’s pretty messy.
MLflow Tracking enforces a routine where each experiment run gets captured with parameters, metrics, and produced artifacts. An effective MLOps platform like MLflow keeps this process consistent across your team. In practice it tends to look like this:
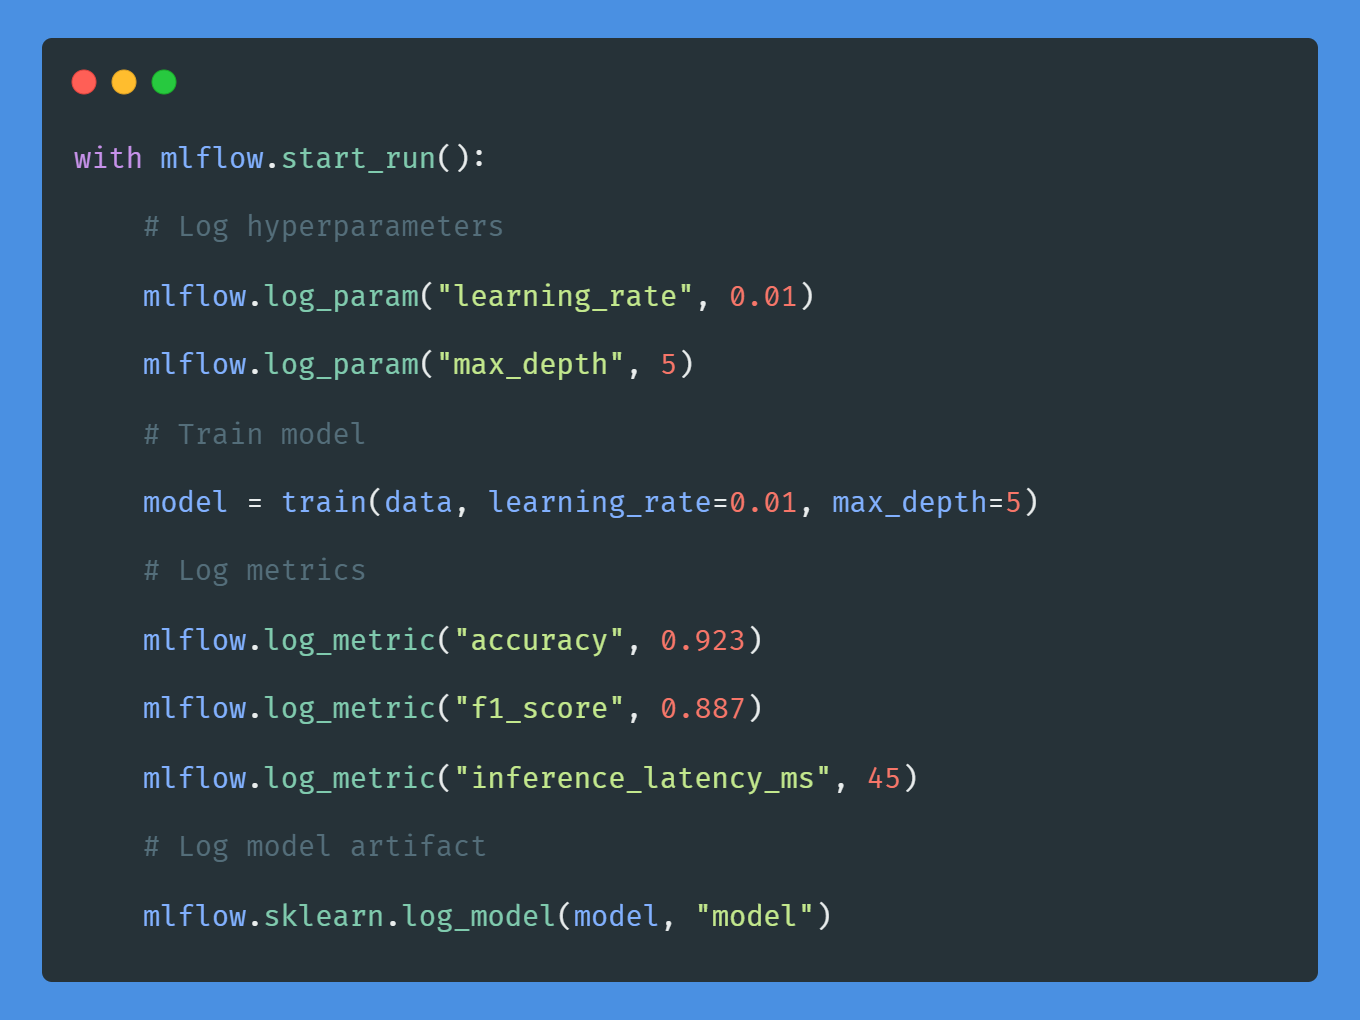
This creates a record you can actually search and query. In the Databricks interface you see all the runs with their parameters, metrics, and can line them up side by side to compare. Filter with something like accuracy greater than 0.92 to get the three runs that made the cut. You can plot how accuracy shifts while learning rate goes up, and that kind of transparency is basically the real foundation of reproducible ML.
Best practice: log more than just accuracy. Add latency, memory consumption, training duration, and inference time. If it’s relevant, even business signals matter. A model at 95 percent accuracy but with an 8-second latency might not be usable for live, real-time systems at all.
Managing Models with the MLflow Model Registry
Once you have a trained model, the Registry is where that model resides. Register a model from a logged run, and the Registry keeps track of all the versions for that model, sort of like a living index.
Each model version comes with a stage: None (logged but not staged), Staging (ready for testing), Production (live and serving), or Archived (superseded). You can promote a model from Staging to Production via the UI or through an API, and the Registry maintains an audit log showing who promoted it and at what moment.
Databricks ties this into approval workflows as well. Before a model goes into Production, it may require approval from some designated user or team depending on how you configured it, which helps stop a junior engineer from accidentally pushing an untested model into production. For regulated industries like BFSI (Banking, Financial Services, and Insurance) and healthcare, this audit trail is non-negotiable. You really have to demonstrate which model was live on a specific date and who approved it.
Deploying MLflow Models on Databricks
Databricks Model Serving runs your registered MLflow models as REST endpoints. You put your model in the Registry and hit Serve. Within seconds, it’s sitting behind a load-balanced API endpoint, basically ready.
What’s happening under the hood is this: Databricks spins up serverless computers and pulls in your model along with its dependencies, then handles HTTP requests. Scaling is automatic and requires no manual intervention. If traffic suddenly goes from 10 requests per second to 1,000 requests per second, the serving layer scales up; when things calm down, it scales down again.
Compare that to the usual Kubernetes route, where you often need a DevOps engineer to craft a Dockerfile, set resource requests, add health checks, and wire up autoscaling rules, plus deal with networking. That whole process can be 3 to 4 weeks depending on the team and approvals. In Databricks, it’s more like one click and you’re done.
The trade-off, though, is the usual one: Databricks Model Serving is proprietary. If you later decide to move to AWS SageMaker or Azure ML, you’ll likely need re-packaging to make it fit their way. For many enterprises staying on Databricks long term, that compromise is worth the speed because time matters. Our data engineering services team helps navigate these architectural decisions at scale.
Best Practices for MLflow Model Tracking and Deployment
Practice 1: Use consistent naming. Name the experiments and runs in a way that’s obvious so everyone on the team can actually find them later. Use something like RandomForest_v2_GridSearch_LR001_MD5 instead of test1 or final_model_20Jan.
Practice 2: Log input and output schemas. MLflow can log model signatures, including input feature names, data types, and output shape details, which helps stop schema drift where the model expects numeric features but somehow receives strings or mixed types instead.
Practice 3: Version dependencies. When you log a model, include the exact versions of TensorFlow, scikit-learn, or other libraries. A model trained with TensorFlow 2.10 might not load cleanly in TensorFlow 2.5. While MLflow tends to handle this automatically, it only works if you set up environments the right way.
Practice 4: Set baseline metrics. Before you push anything to production, compare it with the current production model. If the candidate is only about 0.3 percent more accurate but also adds latency, maybe the bargain isn’t worth it. Write down the rationale too; don’t just assume it will be remembered.
Practice 5: Enable autologging. MLflow autologging grabs parameters and metrics for common libraries without you having to do everything by hand. For scikit-learn, you can switch it on with:
mlflow.sklearn.autolog()
No need to manually log every single parameter. This cuts down the boilerplate and keeps things aligned across the team even when people forget details.
Monitoring and Managing Models After Deployment
Deployment isn’t really the end, you know. Production models tend to degrade over time, what people call data drift or model drift, where a model trained on 2024 data might suddenly look pretty bad on 2025 data simply because the underlying patterns shifted.
MLflow Model Registry stops at versioning though; it doesn’t actually watch performance. You still need other tooling. In practice, Databricks SQL or Lakehouse Monitoring can track inference latency, the distribution of predictions, and even failures that users report. If accuracy slips past a chosen threshold, automated workflows can kick off model retraining.
From our experience with logistics and e-commerce customers, we often see drift happen within 6 to 12 weeks after deployment, especially when business patterns change. That’s why continuous monitoring and retraining pipelines are kind of a must. Similar patterns appear across LLM deployments as well in our LLMOps in production guide.
When NOT to Use MLflow?
MLflow feels like the wrong choice for edge deployment. If your model is running on some phone or a small IoT device with no connection, then MLflow Model Serving basically won’t work. In those cases you want lighter artifacts like ONNX or TensorFlow Lite, not the whole MLOps platform infrastructure.
For a one-person data science effort with no real deployment schedule, MLflow can be overkill. If you’re mainly poking around your data to build a report, you can keep things simple with ad-hoc experiment tracking. The extra overhead only starts paying off when you have several people experimenting at once, and it matters even more when there are multiple models moving into production.
And if you’re targeting real-time use cases with sub-100ms latency requirements, Databricks Model Serving tends to add overhead that may not be acceptable. If raw inference speed is the priority, a Kubernetes deployment with GPU inference servers like Triton is usually the better route, though you lose some monitoring capabilities in exchange for pure throughput and timing stability.
Common Challenges in MLflow Production Workflows
Challenge 1: Dependency Hell. MLflow logs dependencies, but when you try to rebuild them on some other machine it still breaks. You basically end up stuck unless you go with Docker containers and use versioned artifact repositories so the whole thing is more reproducible and not just expected to work.
Challenge 2: Model Size. Big models (5+ GB) can feel painfully slow for loading and serving. A common route is quantization, meaning you reduce model precision, or use model distillation where you train a smaller student model to copy a larger teacher model. MLflow can log the model, but it doesn’t do the optimization piece.
Challenge 3: Access Control. MLflow’s native RBAC is pretty basic, and while Databricks layers workspace-level permissions on top of that, if you want fine-grained control like “Alice can view only these specific models,” it won’t come out-of-the-box. You usually need a custom approach for that level of control.
Challenge 4: Cost at Scale. Databricks Model Serving bills per endpoint compute hour, so serving 100 requests per day ends up costing the same as serving 100,000 a day, which honestly isn’t great if traffic is low. In those cases, batch inference is often the more cost-effective path.
MLflow vs Traditional Model Management Approaches
Spreadsheet tracking (traditional) has data scientists logging results in Excel, which brings problems like no real versioning, no audit trail, no integration with deployment tools, and it’s pretty prone to human error even when people care about accuracy.
Git for models (traditional) stores trained models straight inside Git, but Git repositories aren’t designed for 500MB+ binary files. The versioning turns into chaos, and there’s no proper experiment tracking integration.
Custom notebooks (traditional) gives every project its own logging method, leading to inconsistency, no standardization, and making onboarding new team members a lot harder than it should be.
MLflow acts as the central hub for tracking and deployment, removing a lot of the fragmentation costs that pop up across teams and workflows. When compared to these fragmented approaches, MLflow and similar MLOps tools provide clear value for organizations scaling their machine learning operations.
Real-World Use Cases of MLflow in Production
A mid-sized BFSI (Banking, Financial Services, and Insurance) firm had about 15 ML engineers building credit risk models with zero centralized tracking. Each person ended up using different tools; some kept everything in spreadsheets while others had Jupyter notebooks just sitting locally on their machines. When compliance asked directly which model was actually in production for Q4 reporting, the firm couldn’t give a clean answer.
We rolled out MLflow on Databricks and put approval gates in place. Basically every model had to be registered first, then go through testing before it could move into production deployment. Fast forward 3 months, and the results spoke for themselves:
Model deployment time fell from 6 weeks down to 2.5 weeks. Compliance could audit which model was live on any given date, not just around that quarter. Model retraining cycles shrank from 8 weeks to 3 weeks because engineers could more easily compare performance across iterations. Unauthorized model deployments dropped from 3 per quarter to zero.
Cost-wise, the Databricks cluster ran at $0.40 per hour for 40 hours per week for ML operations infrastructure, coming to around $830 annually. The ROI mostly came from cutting manual deployment overhead that used to consume about 0.8 FTE per quarter, which was the biggest lever.
How Durapid Technologies Helps Enterprises Deploy MLflow on Databricks?
Durapid has deployed MLflow in production across BFSI, logistics, healthcare, and retail, with 90+ enterprise projects, 150+ Microsoft-Certified Professionals, and 95+ Databricks-Certified Professionals on the team. Our team handles MLflow architecture and integrates it into existing data pipelines, establishes approval workflows, and builds monitoring infrastructure.
We design with scale in mind. We’ve rolled out MLflow pipelines that process 10+ million predictions each day. Supporting teams moving away from manual model releases into truly automated CI/CD workflows is something we do regularly. For teams building end-to-end ML systems, our AI ML solutions help ensure MLflow is deployed correctly from day one.
Next Step: Kick off with an MLflow proof-of-concept on Databricks. We assist with tracking setup and help establish model governance so you get your first model into production within 3 to 4 weeks. Reach out for a technical consultation.
FAQs: MLflow in Production
Q: How long does it take to set up MLflow on Databricks?
A: If you’re already on Databricks, it can take around 5 minutes since MLflow is basically pre-installed. If you need an on-premises MLflow Server deployment, plan for 2 to 3 days, mostly because of the infrastructure arrangement.
Q: Can I use MLflow with models trained outside Databricks?
A: Yes, absolutely. MLflow is framework-agnostic, so you can train using PyTorch on your own laptop or local machine, then log the runs to a remote MLflow Server and handle serving through Databricks Model Serving.
Q: What happens if an MLflow model fails in production?
A: Databricks Model Serving has automatic rollback built in, so when inference errors start spiking, you can revert to the previous model revision via the UI or through the API.
Q: How much does MLflow on Databricks cost?
A: MLflow on its own is open-source, so it’s free. The part that costs is Databricks Model Serving, which charges per endpoint compute hour, often around $0.60 to $0.80 an hour depending on the compute size.
Q: Does MLflow work with Kubernetes?
A: Yes. You can deploy MLflow models as containerized services on Kubernetes for mixed cloud scenarios or truly on-premises environments, depending on what you need.

Recent Blog

How Voice AI Connects Calls With Sales Operations
October 15, 2026-
How GCCs Can Scale Engineering Teams with Staff Augmentation?
October 10, 2026 -
Asset Management Software for CFOs: From Depreciation to Capital Planning
September 29, 2026 -
Why Voice AI Is Different From Chatbots in Recruitment?
September 17, 2026