Real-Time Supply Chain Data Pipelines with Kafka and Databricks
Most supply chains still run on overnight batch jobs, where inventory numbers get updated every morning, sometimes later than planned. Carriers typically report shipment status hours after the handoff, by which point the decision window has already narrowed. Even demand forecasts tend to refresh once per day, so by the time anyone looks at the data, the opportunity to act on it has largely passed.
Real-time supply chain data pipelines close that gap. Apache Kafka streams events from warehouses, vehicles, ERPs, and suppliers into a Databricks lakehouse, allowing teams to notice disruptions within minutes instead of hours. Inventory mismatches surface as alerts before they escalate into stockouts, demand signals get used immediately for replenishment instead of sitting idle, and carrier delays show up quickly enough that rerouting shipments becomes a practical option.
This isn’t theoretical. In our deployments at Durapid, organizations using real-time supply chain data pipelines have cut order-to-visibility latency from 4 to 6 hours down to under 30 seconds. One mid-market logistics provider runs Kafka alongside Databricks Delta Live Tables, handling 12 million shipment events daily and making operational decisions 40x faster than before.
Why Supply Chain Data Cannot Wait Until Morning?
The cost of delayed visibility compounds hour by hour. A 2024 McKinsey study found that companies relying on batch ETL processes see roughly 3 to 5% annual margin erosion, largely because demand signals arrive late, inventory details don’t reconcile, and carrier windows get missed. For a logistics business running $500 million in revenue, that translates to roughly $15 to 25 million in unrecovered value.
The problem isn’t only timing. Traditional batch pipelines refresh data on fixed calendars, usually overnight or early morning, which works fine when supply and demand move predictably. When they don’t, the approach breaks down quickly. Consider e-commerce orders landing on a retailer’s platform at 2 PM. The batch job still runs at midnight, so orders sit in queues, inventory counts stay stale, and by the time the warehouse sees updated demand, backlogs have already built up.
Supplier disruptions compound the problem further. If a component shipment slips, batch-based systems typically don’t notice for 12 to 24 hours, and by then manufacturing teams have already planned production assuming on-time delivery. Once the delay surfaces, the production slot is locked and changeover costs spike. Real-time supply chain data pipelines remove that gap by ingesting every order, shipment event, and inventory adjustment within seconds, giving decision-makers a current view of supply and demand rather than numbers that were accurate yesterday but no longer reflect reality.
What a Real-Time Supply Chain Data Pipeline Actually Is?
A real-time supply chain data pipeline is an architecture that continuously ingests, transforms, and exposes supply chain events as they happen, rather than on a fixed schedule. It functions less like a series of discrete jobs and more like a continuous flow of data moving through the system.
The architecture typically comes in three layers. The ingestion layer captures events from a wide range of sources, including IoT sensors in warehouses, ERP transaction logs, WMS shipment updates, carrier APIs, and point-of-sale systems. Apache Kafka plays the central role here, functioning much like the nervous system of the pipeline by collecting those streams into partitioned topics so data moves without unnecessary friction. In our supply chain data architecture work at Durapid, this layer tends to be the foundation everything else is built on.
The transformation layer lives in Databricks, where Delta Live Tables processes raw events through quality gates, deduplication, and business rules. Bronze tables hold raw data exactly as it arrives, silver tables clean the data and validate schemas, and gold tables generate analytics-ready facts such as shipment aggregates, inventory snapshots, and demand signals that feed dashboards and AI models.
The consumption layer is where people and applications actually use the data. Real-time dashboards show warehouse occupancy and inventory velocity, demand forecasting models consume live POS data alongside order streams, operational applications trigger alerts when thresholds are crossed, and APIs serve downstream systems that need fresh information to support fast decisions.
Batch Pipelines vs Real-Time Streaming in Supply Chain?
This distinction matters because it determines which decisions are even possible. A batch pipeline processes data in fixed windows, usually once per 4, 6, or 24 hours, and between those windows the data grows progressively stale. A real-time pipeline, by contrast, processes events continuously while maintaining current state.
In practice, this difference translates directly into operational capability. With batch-based inventory visibility, stock-count errors often go unnoticed for 24 hours, and by then teams have already promised multiple orders based on inaccurate numbers. Real-time ingestion allows errors to be spotted and corrected within minutes, before they cascade into bad decisions.
Batch-based demand sensing relies on daily or weekly snapshots, so a demand spike from yesterday only triggers replenishment today. Real-time demand sensing processes POS events as they happen, meaning a surge detected within the hour can trigger immediate action, whether that’s faster manufacturing, carrier alerts, or supplier notifications before inventory runs out.
Where the Latency Gap Costs Real Money?
Consider a mid-market fashion retailer we worked with. Their batch pipeline updated warehouse quantities and online figures every 6 hours. During flash sales, demand spiked, but the pipeline didn’t reflect it for hours, so the sales team worked off delayed numbers and promised inventory that was already spoken for but invisible in their warehouse view. Those oversells, along with the resulting cancellation fallout, cost around $240K per quarter in carrier charges and relationship damage.
After moving them to a Kafka-Databricks real-time supply chain data pipeline, the picture changed considerably. They now stream POS events in real time, and the moment inventory undersells, the allocation logic rebalances and fulfillment systems reroute orders to the closest warehouse with available stock. Oversells dropped 87% in the first month, with time to value under 6 weeks, faster than initially expected.
Why Kafka and Databricks Work Together?
Kafka on its own gives you event capture, but with little to no transformation, which means building all the orchestration yourself end to end. Databricks on its own has no real buffering layer to absorb producer bursts, which means constantly tuning and scaling clusters just to keep pace with incoming data.
Together, the two work seamlessly. Kafka absorbs the complexity of many different producers, while Databricks handles stateful transformation such as cleaning, joining, and reshaping. Kafka also keeps producers separate from consumers so they don’t block one another, which matters considerably when supply chains involve dozens of systems operating on inconsistent timing. At scale, one global manufacturer ingests 150 million supply chain events daily across 40 warehouses. Kafka partitions handle throughput and concurrency, while Databricks deduplicates and transforms the data into gold-layer facts that feed dashboards and ML models.
Real-Time Supply Chain Use Cases
Inventory Visibility. A fashion retailer streams WMS data into Databricks. When a flash sale creates unexpected demand, POS events trigger immediate reallocation, and oversells dropped 87% in the first month. Learn more about how our AI and ML solutions enable this real-time visibility.
Demand Sensing. An FMCG distributor routes POS transactions into a demand forecasting model. Real-time data lets the model catch demand shifts within hours rather than days, and forecast accuracy jumped from 71% to 86% while inventory turns increased 12%. This is where real-time supply chain analytics makes a measurable impact.
Shipment Tracking. A logistics provider pipelines carrier API data into gold tables, so operations teams catch performance problems almost instantly. When on-time delivery falls below 92%, alerts fire and dispatch reroutes to other carriers, a change that cut carrier-caused delays by 63%.
Route Optimization. A delivery company merges vehicle GPS, traffic, and package details into Databricks, and real-time optimization algorithms recalculate routes every 5 minutes. Delivery cost per package dropped 8%, while on-time delivery climbed to 97% from 91%. Our data engineering services can help build these pipelines for your operation.
Pipeline Architecture
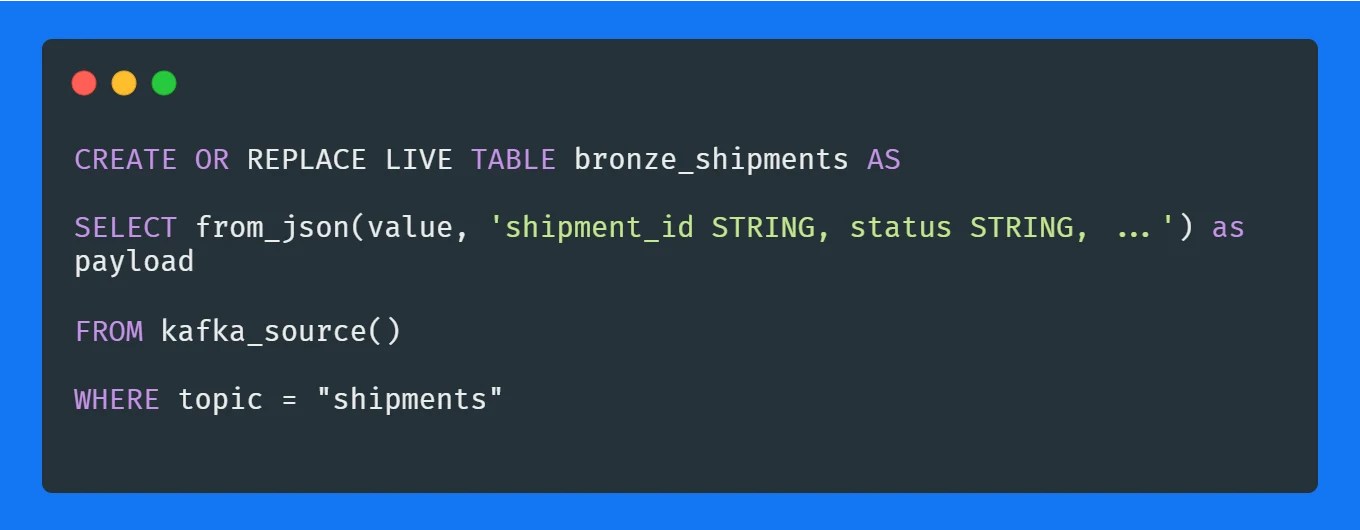
Bronze Layer: Raw Kafka events land here exactly as received.
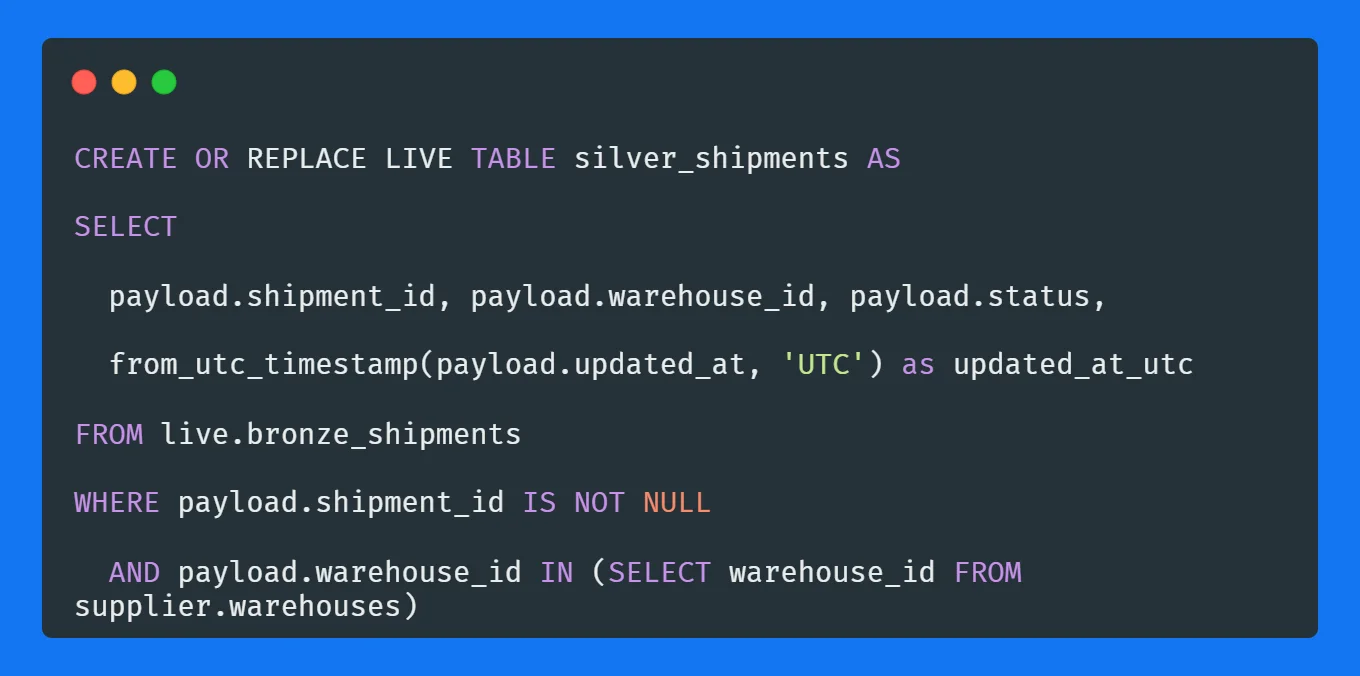
Silver Layer: Validate schema, deduplicate, apply business rules, join dimensions.
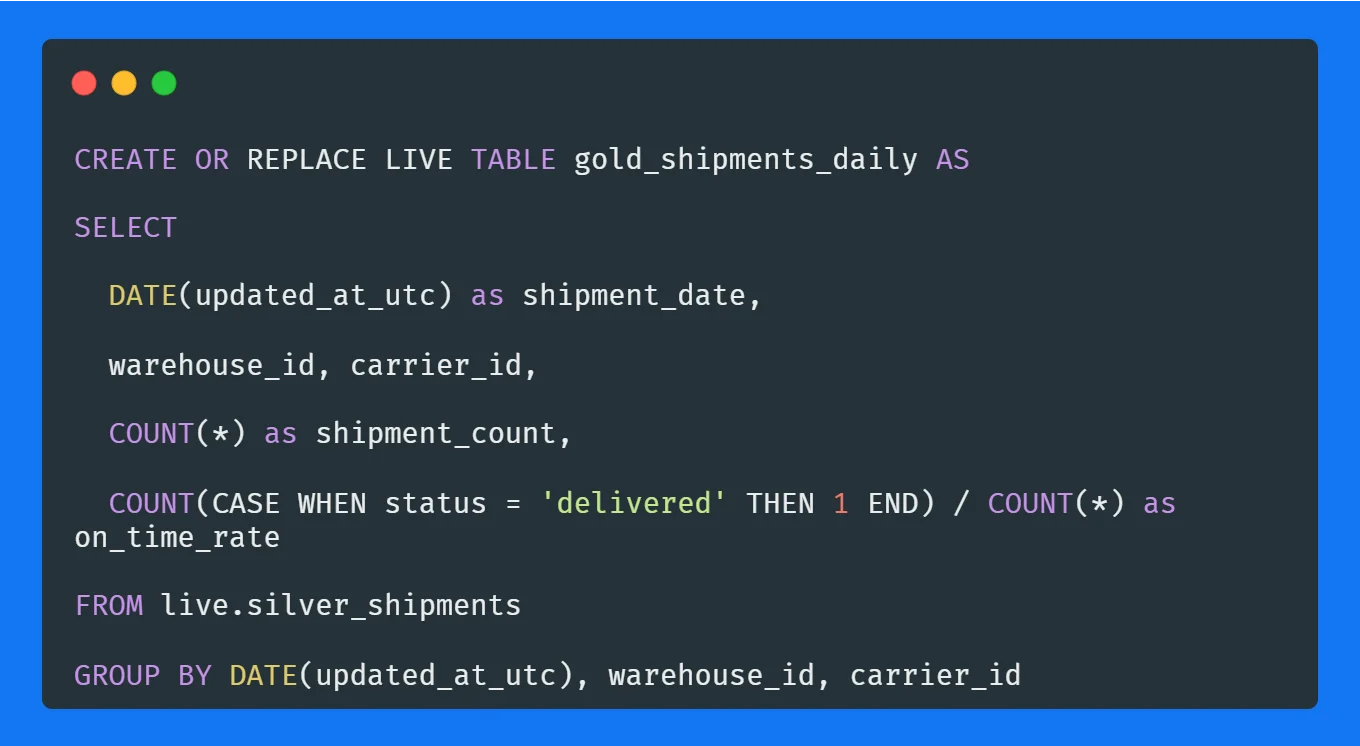
Gold Layer: Aggregations optimized for analytics and AI.
Implementation Roadmap
Phase 1 (Weeks 1 to 8): Choose one high-value use case, such as inventory visibility, demand forecasting, or shipment tracking, and build the end-to-end flow for that use case alone. Most teams see ROI within roughly 12 weeks.
Phase 2 (Weeks 4 to 10): Wire Kafka to 2 to 3 sources, such as ERP logs and warehouse IoT sensors, then validate throughput and latency under peak load rather than test load.
Phase 3 (Weeks 8 to 14): Build out the Delta Live Tables medallion pipeline and iterate on data quality rules with supply chain teams. Plan for 4 to 6 weeks of refinement, since the first pass is rarely final.
Phase 4 (Weeks 12 to 16): Connect dashboards and downstream systems, validating data quality with business teams before introducing AI models. Skipping this step tends to cost more time later than it saves upfront.
Target: production-ready real-time supply chain data pipelines in 12 to 16 weeks, pulling from multiple sources.
Common Challenges and How to Handle Them
Schema Drift From Supplier and Carrier Systems
Suppliers’ systems evolve, and carriers’ APIs regularly add new fields or rename existing ones. If a pipeline is tightly coupled to a fixed schema, these changes break it. The solution is defensive parsing using Databricks’ schema merging, which allows new fields to be appended automatically rather than failing the entire job.
SELECT
from_json(value, “SCHEMA {shipment_id STRING, status STRING, …}”,
map(“mode”, “PERMISSIVE”)) as payload
FROM kafka_source()
Permissive mode ignores unknown fields rather than failing the job, so those fields still arrive in the data where analysts can investigate them, without breaking the pipeline.
Kafka Partition Sizing for Peak Supply Chain Volumes
Partition Kafka for peak throughput plus headroom, since events like Black Friday can triple order volume. Provisioning only for normal traffic causes latency to spike under those conditions. For 500K orders daily, expect 5 to 10x volume on peak days, and partition for 2x peak rather than average. As a general guide, a 50-partition topic can handle roughly 10 million orders daily; beyond that threshold, additional partitions are needed.
Network bandwidth also deserves attention, since a single partition can still create a bottleneck even when overall partitioning looks adequate. Distributing partitions across brokers prevents any single broker from becoming overloaded.
Legacy ERP Integration Without Disrupting Operations
Older ERPs typically don’t support event APIs natively, so integrating them into a real-time supply chain data pipeline usually requires middleware. Change data capture (CDC) tools such as Debezium or Attunity track ERP transaction logs for updates, extract the changes, and produce events into Kafka. This keeps the ERP itself unchanged and the integration layer separate, and while CDC involves a learning curve, it removes the need to modify legacy applications.
From Batch ETL to Real-Time Pipeline
Phase 1: Identify the Highest-Value Use Case First
Rather than attempting to modernize everything at once, identify the part of the supply chain where delays cost the most, whether that’s inventory drift, shipment delays, or demand forecasting. Choose whichever use case delivers the highest ROI with real-time data, build the end-to-end pipeline for it first, and aim to reach production in 8 to 12 weeks before expanding into other areas.
We partnered with a mid-sized logistics firm that started with shipment visibility. Within 3 months, real-time tracking cut service requests by 22% and improved delivery visibility, and that early win funded the next phase. The firm then moved into demand forecasting, demonstrating how real-time supply chain data pipelines can create measurable payback quickly.
Phase 2: Connect Kafka to ERP and IoT Sources
Start with 2 to 3 sources, typically ERP logs and warehouse sensors, using Kafka connectors for the ERP stream and MQTT bridges for IoT devices.
Test event volume and latency under peak load. A 500-seat ERP generates 2K to 5K events per minute during order processing, while a 100-sensor warehouse generates 10K to 20K events per hour. Kafka can handle this volume, but network capacity should be validated in advance. Our Databricks consulting services can help validate this before launch.
Phase 3: Build a Delta Live Tables Pipeline with Quality Gates
Set up bronze, silver, and gold layers in parallel, keeping bronze and silver tables ready first so data quality can be checked early, before the gold layer is complete. Start with simple transformations, validating schemas, removing duplicates, and joining dimensions, then layer in more complex logic once the pipeline is stable.
Plan for 4 to 6 weeks of data quality iteration, since supply chain teams will typically identify edge cases that the initial schema missed, and those details often matter more than expected.
Phase 4: Connect the Consumption Layer and Monitor
Build dashboards on gold tables first, letting business teams validate data quality before it moves downstream. Dashboards allow feedback to be collected safely without disrupting the pipeline. Once dashboards are validated, build APIs for downstream systems, such as an inventory optimizer that queries gold tables every 15 minutes or a fulfillment system that needs current inventory. These should be built incrementally rather than all at once.
Monitor latency end to end. Kafka-to-Databricks latency should stay under 2 minutes for most real-time supply chain analytics; if it runs higher, check partition counts, adjust cluster sizing, or investigate network limits.
Why Durapid Builds Real-Time Supply Chain Data Pipelines?
Supply chain data architecture is inherently complex. Kafka requires genuine distributed systems experience rather than a quick setup, and Databricks depends on strong SQL skills and data governance discipline. Most organizations don’t have both in-house, particularly when supply chain teams need to move quickly and internal IT teams can’t build yet another framework from scratch.
Durapid’s data engineering services combine cloud infrastructure expertise, Kafka administration, Databricks development, and supply chain domain knowledge. We’ve delivered 90+ real-time supply chain data pipelines for enterprises ranging from startups to Fortune 500 manufacturers, which means we’ve already encountered most of the common pitfalls and can help clients find faster routes around them.
If you’re evaluating real-time supply chain data pipelines, our Kafka and Databricks consulting team can guide your decisions.
Next Steps
Real-time supply chain visibility is no longer a luxury, it’s a competitive necessity. Companies operating with 30-second latency make decisions 40x faster than teams relying on batch ETL every 6 hours, and that gap only widens the longer it goes unaddressed.
Durapid focuses on real-time supply chain data pipelines for enterprises, running Kafka and Databricks across logistics, manufacturing, and retail. We know where problems tend to surface first and which approaches deliver ROI fastest, and our logistics industry expertise combined with data engineering means we architect solutions built for your specific operation.
Set up a consultation with our data engineering team about your real-time supply chain analytics needs. We’ll review what you have, identify the highest-value use cases, and sketch a roadmap to production. Most clients see measurable improvement within 12 to 16 weeks.
[Talk to a Data Engineering Expert]
FAQ
Q: What kind of latency should I expect?
Kafka-to-Databricks latency should stay under 2 minutes for most scenarios. End-to-end latency, from event to dashboard, typically runs 30 seconds to 2 minutes, depending on the number of hops and transformations involved.
Q: How long does the full implementation usually take?
A proof of concept with one source typically runs 6 to 8 weeks, while a production pipeline across 5 or more sources takes 12 to 16 weeks. Expect to revisit the initial mapping once real production volumes arrive.
Q: Which use cases tend to deliver ROI first?
Inventory visibility and demand sensing typically show ROI within about 3 months. Supplier risk monitoring and route optimization take longer to implement but tend to deliver larger absolute savings over time.
Q: Can this integrate with our existing ERP setup?
Yes. Most modern ERPs expose event APIs or support CDC natively. For older systems, CDC tools like Debezium can stream changes into Kafka without requiring any rewrite of the ERP itself.
Q: Which industries benefit the most?
Logistics, retail, manufacturing, and FMCG tend to see ROI almost immediately. Healthcare, automotive, and aerospace also benefit, though regulatory traceability requirements typically extend implementation timelines in those industries.

Recent Blog

How Voice AI Connects Calls With Sales Operations
October 15, 2026-
How GCCs Can Scale Engineering Teams with Staff Augmentation?
October 10, 2026 -
Asset Management Software for CFOs: From Depreciation to Capital Planning
September 29, 2026 -
Why Voice AI Is Different From Chatbots in Recruitment?
September 17, 2026