MLOps Model Monitoring: How to Track Model Drift & Performance in Production
MLOps Model Monitoring sounds like something you set up once and forget. It’s not. Because the moment your model goes live, it starts changing. Quietly, consistently, and often without warning. The data it sees in production is never the same as training. User behavior shifts. Inputs evolve. Context changes. And before you realize it, the model you trusted is no longer the model you deployed.
That’s why model monitoring isn’t just a technical layer in MLOps. It’s the system that tells you whether your model is still working, or just running. Today, machines are learning faster than ever. Across industries, from AI Marketing Agents optimizing campaigns to AI in Manufacturing predicting failures, models are making decisions in real time. But here’s the catch: If you don’t actively monitor ML models, you won’t see model drift coming. You won’t catch performance drops early. And you definitely won’t understand the performance implications in production until they hit your outcomes.
This is exactly where MLOps Model Monitoring becomes critical. Not just to track accuracy, but to understand how your model behaves in the real world, with real data, real users, and real consequences. In this blog, we’ll break down how AI and ML systems are monitored after deployment, how to detect and respond to drift, and how to build a monitoring layer that keeps your models reliable, relevant, and ready. Long after they go live. Because deploying a model is step one. Making sure it keeps working, is everything.
What Is MLOps Model Monitoring?
Your machine learning model achieved 94% accuracy during testing. You deployed it with complete assurance. The prediction system failed to forecast three different outcomes which included 31% revenue predictions and incorrect customer churn alerts which persisted on false accounts and the reasons behind these issues remained unknown. This situation occurs as a common occurrence. According to Gartner, 85% of AI projects fail to reach production or degrade significantly after deployment. The primary reason for project failure exists because organizations lack effective MLOps model monitoring procedures.
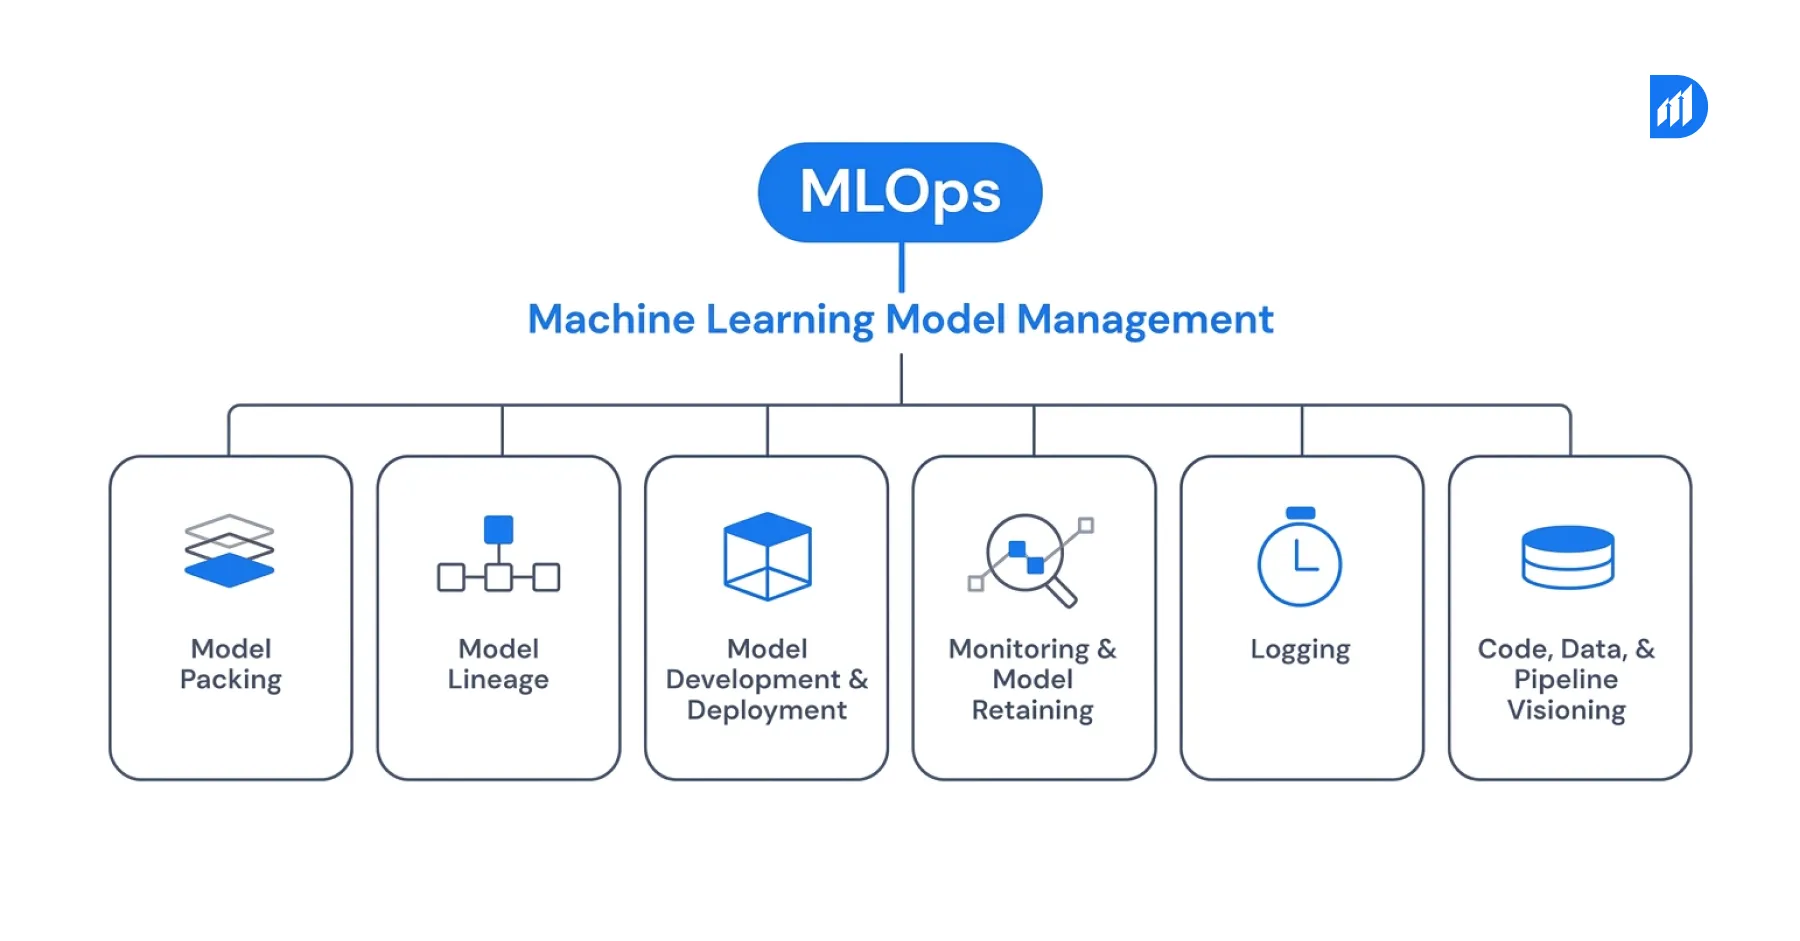
MLOps model monitoring exists as a practice which enables organizations to observe the complete status of their deployed models through their operational performance and prediction results and the quality of their incoming data during continuous operation. The absence of this monitoring system enables models to deteriorate without detection by your teams.
MLOps model monitoring involves tracking the operational performance of a machine learning model throughout its lifespan to verify its ongoing compliance with expected results. The system monitors incoming data and produces predictions while assessing model performance and maintaining system health. The operational layer functions as a bridge that connects deployment with retraining activities. It continuously assesses whether the model maintains its original training functions.
The monitoring system works together with the entire MLOps development process through the integration of MLflow and Azure ML and Amazon SageMaker Model Monitor and Evidently AI. The system operates by creating logs which activate alerts while it simultaneously supplies data for retraining processes.
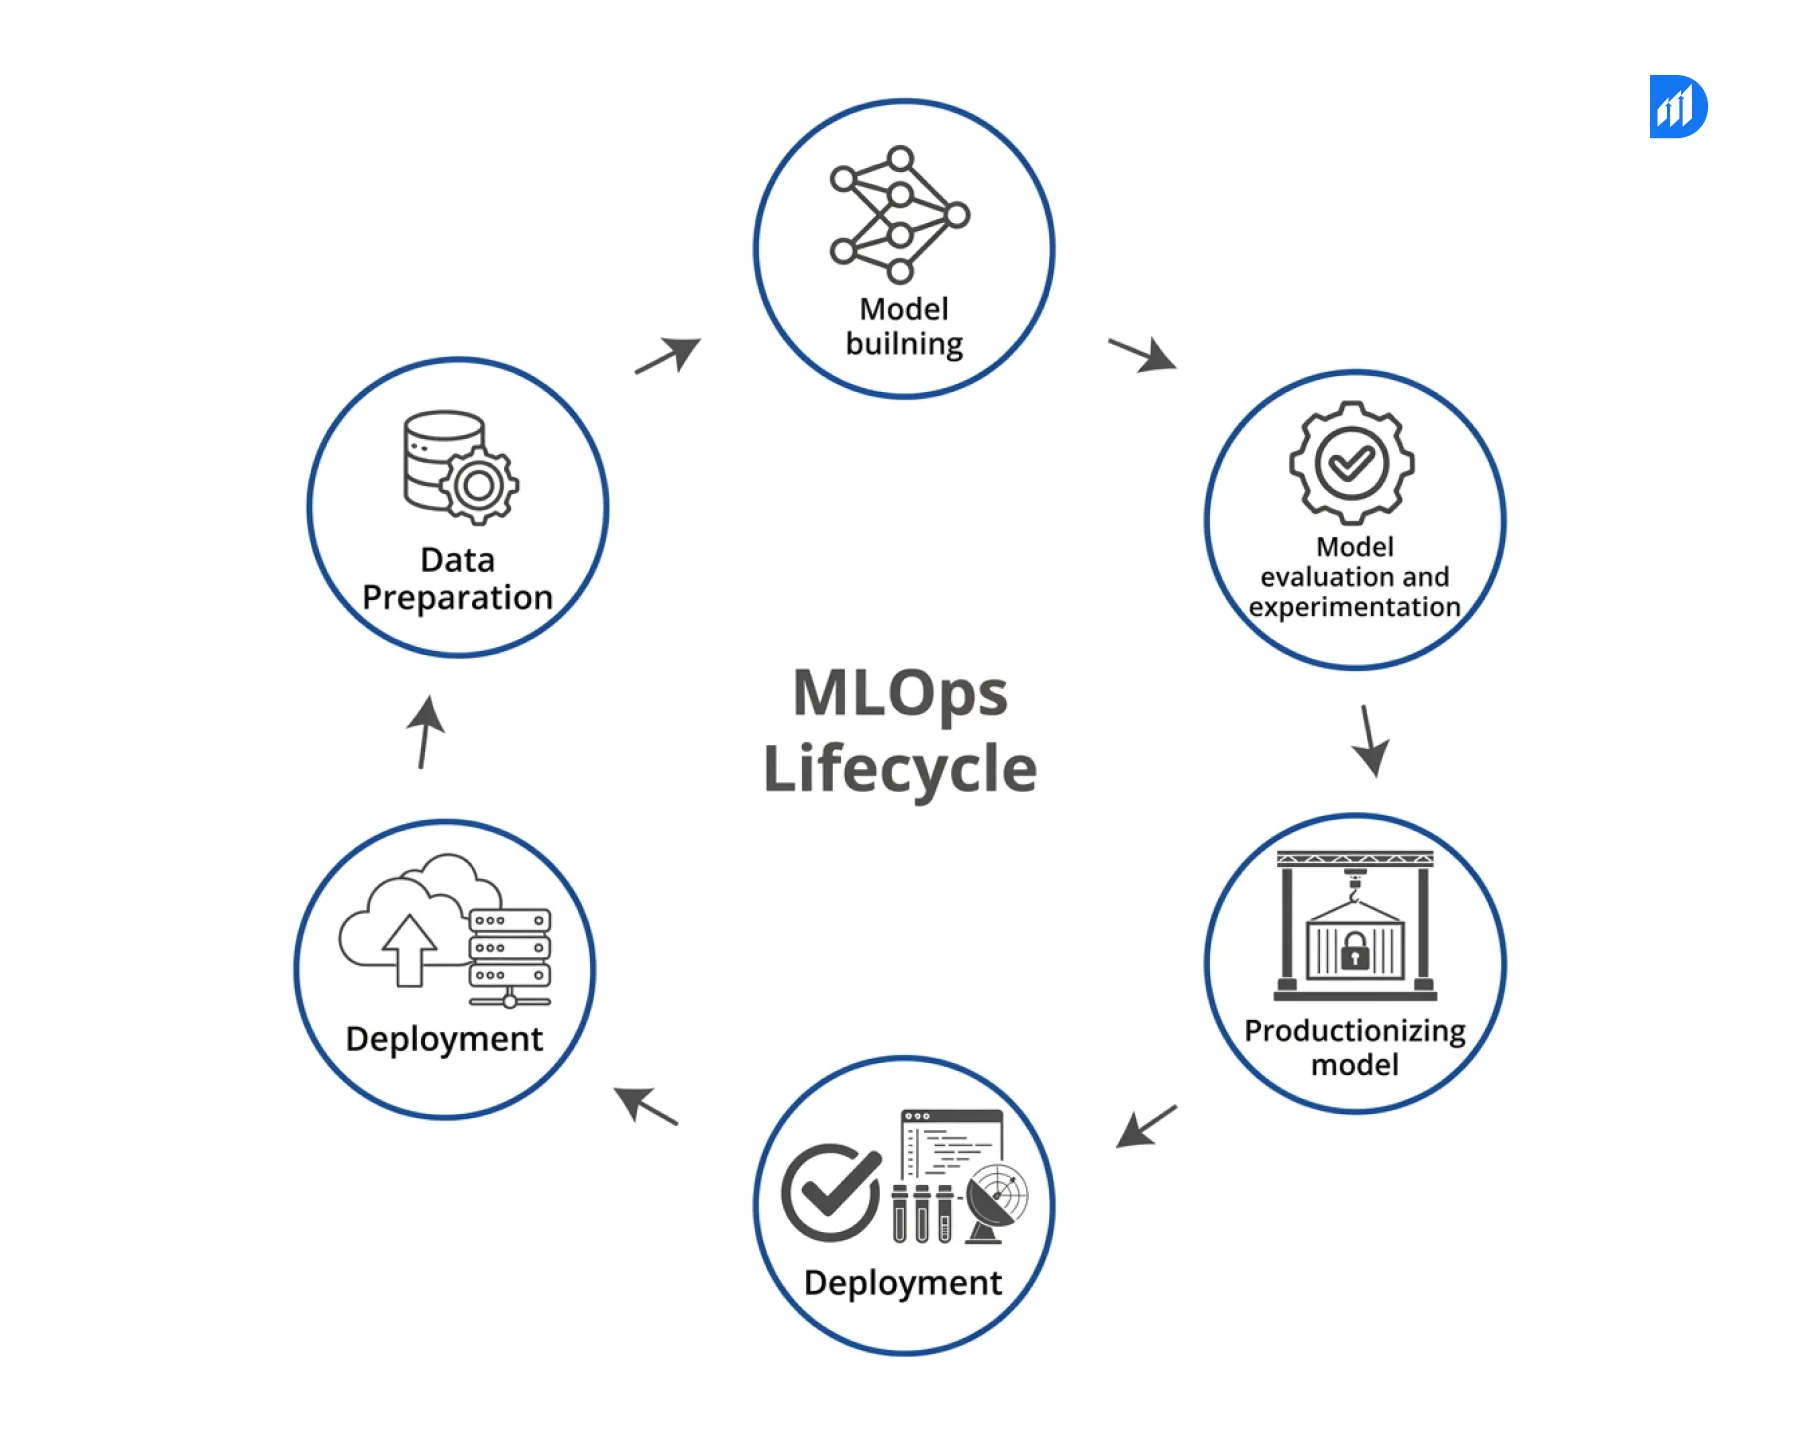
How Model Monitoring Fits Into the MLOps Lifecycle?
The MLOps lifecycle moves through data preparation, training, validation, deployment, and monitoring. All teams dedicate most of their resources to the first four stages while they provide insufficient support for the remaining stage. Monitoring functions as an ongoing process because it requires constant evaluation instead of existing as a single evaluation point. The system begins model retraining whenever model performance drops below established standards. It also raises an alert when data quality falls below acceptable levels which affects the preceding data processing system. The advanced closed-loop system design of an organization enables it to achieve superior MLOps results compared to simple model deployment methods.
According to McKinsey, organizations leveraging AI in manufacturing with mature MLOps pipelines reduce model failure rates by 60% and deploy updates 5x faster than teams using manual monitoring approaches.
Key Types of Model Drift You Need to Track
The three main types of model drift require teams to conduct continuous monitoring. Data Drift occurs when input features show alterations in their statistical properties throughout the passage of time. A fraud detection model which used 2022 transaction patterns for training will encounter entirely different transaction volumes and merchant categories throughout 2024. Concept Drift occurs when input and output relationships in a system change.
A model developed to forecast customer turnover will base its predictions on incorrect indicators after the market experiences its upcoming disruption. Prediction Drift occurs when model output distributions change despite the presence of constant input data. This situation usually indicates an issue with the data pipeline which exists earlier in the process or a hidden problem with feature engineering. All three types necessitate distinct detection methods along with separate response protocols.
Critical Performance Metrics to Monitor in Production
The correct metrics establish a boundary which distinguishes between reactive firefighting and proactive model management. The production ML systems use these metrics as their most important performance indicators.
| Metric | What It Measures | Alert Threshold |
| Prediction Accuracy | % of correct predictions vs ground truth | Drop > 5% from baseline |
| Feature Drift Score | Statistical distance from training distribution | PSI > 0.2 |
| Data Quality Score | % of missing, null, or out-of-range values | > 2% of records |
| Latency (P95) | 95th percentile inference response time | > 200ms for real-time |
| Throughput | Requests processed per second | Below SLA threshold |
| Error Rate | % of failed or timeout predictions | > 0.5% |
Your baseline values should not match the table’s industry standard thresholds because your organization requires different baseline values for each AI and ML model type and business domain. The validation stage should be the time to establish these requirements because organizations need to avoid creating them after production failures occur.
Step-by-Step Process to Set Up Model Monitoring in Production
The process of establishing monitoring systems requires multiple days because it needs collaboration among data engineering and ML engineering and platform teams.
Step 1: Define your baseline. Model training and validation require you to record the distribution of all input features together with the output prediction distributions. This reference point helps you identify drift patterns.
Step 2: Instrument your inference pipeline. Predictive request logs should include all input data and output results and request time and model identification. The combination of Apache Kafka with AWS Kinesis provides an efficient solution for handling high-volume logging requirements.
Step 3: Set up a feature store integration. Use a feature store (Feast, Tecton, or Databricks Feature Store) to track how features change between training and serving. The system identifies training-serving distribution shifts which lead to drift problems.
Step 4: Choose a monitoring platform. The available options include Evidently AI which supports open-source teams and Azure ML’s data drift detection system which serves Microsoft-stack organizations and Arize AI and WhyLabs which provide enterprise-level observability solutions.
Step 5: Configure alerts and dashboards. The system should send alerts through Slack and PagerDuty and your chosen incident management system. Power BI and Grafana serve as tools for stakeholders to access dashboard information without requiring engineering access.
Step 6: Connect monitoring to your retraining pipeline. Your monitoring system requires integration with your retraining pipeline. The system will launch a retraining job when drift thresholds reach their maximum limits. Your MLOps model registry (MLflow, Azure ML Registry) will serve as the repository for your new model while you conduct A/B testing to control traffic distribution.
Common Challenges of Model Monitoring in MLOps
The same challenges that all teams face when they develop monitoring systems emerge as problems for experienced teams. The most common issue is delayed ground truth. Your model will need to wait 30 to 90 days before you can verify customer churn prediction accuracy. Real-time accuracy-based alerts become nearly impossible to create in that window. Alert fatigue presents a significant problem for organizations. Teams that monitor too many metrics without proper threshold tuning generate hundreds of false positive alerts per day. Engineers quickly start ignoring them.
Data volume and operational cost create a third challenge. The process of logging every inference request at scale produces daily data volumes that reach terabytes. The expenses of monitoring can surpass the expenses of the actual model when organizations lack an effective approach for sampling and storing data.
Practical Solutions to Overcome Model Monitoring Challenges
Each challenge above has a well-tested solution that leading ML teams use today. The process requires proxy metrics until actual outcomes become available for evaluation. Churn labels need 60 days to complete while users should track behavioral signals through login frequency and support tickets and usage drop as main indicators of model performance loss.
The organization needs to create multiple levels of alerts to solve the problem of alert fatigue. The system should use three severity levels which include informational and warning and critical categories. Only page on-call engineers when the situation reaches critical thresholds. Send warnings to a monitoring dashboard which teams will check every week.
The organization must apply statistical sampling methods to solve its challenges with data volume and operational expenses. Logging 100 percent of user requests is not required to detect drift patterns. The organization can achieve 95 percent confidence in drift detection by monitoring 5 to 10 percent of traffic using a statistically valid sample which requires less storage space.
Model Drift Detection Techniques and Approaches
Several statistical methods power drift detection in production ML. Your data types together with your monitoring frequency will determine which option is most suitable for you. The Population Stability Index (PSI) serves as the primary method used to identify distribution shifts which occur in continuous data. A PSI value which exceeds 0.2 indicates that significant drift occurred and requires further examination.
The Kolmogorov-Smirnov (KS) Test enables statistical comparison between two different distributions. It works well for detecting data drift in numerical features with high cardinality. Jensen-Shannon Divergence functions as a tool to assess how two different probability distributions share commonality. Non-technical stakeholders find it easier to understand the symmetric and bounded nature of Jensen-Shannon Divergence compared to KL divergence. The Chi-Square Test functions effectively with features that exist in categorical form. It detects category distribution shifts which remain undetected by both PSI and KS tests.
Role of Alerting and Automated Retraining in Model Monitoring
Sound without purpose results in audio disturbance. The goal of any monitoring system is to close the loop automatically wherever possible.
When monitoring identifies a PSI reading above 0.2 on a critical feature, the system must initiate a data quality investigation and send an alert to the data engineering team. When prediction drift remains above the threshold for three consecutive days, it should initiate retraining through the latest labeled data automatically.
The MLOps model registry serves as an essential component for this process. The MLflow registry system documents every model version together with its associated training data and hyperparameter settings and evaluation results. When automated retraining produces a new version, the registry preserves it and evaluates it against the existing production model before directing any real-time user traffic.
Data Quality, Logging, and Observability in Production ML
Data quality issues cause more model failures than algorithm problems. A 2023 study by IBM found that poor data quality costs organizations an average of $12.9 million per year.
Every production ML system needs three observability layers. Infrastructure observability uses Prometheus and Grafana to monitor CPU and memory and latency. Data observability tracks schema changes and null rates and value distributions through tools like Great Expectations or Monte Carlo. Model observability tracks prediction distributions and drift scores and business KPIs through dedicated ML monitoring platforms. These three layers together give you full visibility into what is happening, why it is happening, and how to fix it.
Future Trends in MLOps Model Monitoring
The MLOps domain for model monitoring develops at a rapid pace. Three emerging trends will determine how production ML systems function in their next evolution.
Real-time drift detection is replacing batch-based monitoring. Teams now use Apache Kafka and Flink streaming architectures to achieve real-time anomaly detection which operates at less than one-second intervals rather than conducting daily or hourly drift checks.
Monitoring of LLM and generative AI is creating entirely new challenges for organizations. Language model outputs do not show any applicability for traditional drift metrics. New techniques combining semantic similarity scoring with toxicity detection and hallucination rate tracking are emerging as the standard.
Automated root cause analysis is decreasing the time needed to resolve issues. Arize AI and Fiddler AI now use causal inference methods to find which features caused a drift event, which reduces investigation time from hours to minutes.
How to Build a Robust Model Monitoring Strategy for Production
The development of a monitoring strategy depends on its initial planning process. The first four decisions must be completed before you start writing monitoring code.
- Business SLAs need to be established first. What accuracy level is acceptable? What latency needs to be tolerated? What expense results from an incorrect prediction? Your alert thresholds depend on these answers.
- Establish your actual ground truth delay time. Know the duration required to obtain labeled information. Then decide whether you need proxy metrics and what those proxies are.
- Assign a clear owner to monitoring alerts. Without a defined escalation path, alerts get ignored.
- Plan your retraining schedule. Retraining will occur on either time intervals of weekly or monthly basis or special events which occur when drift starts. Most advanced teams operate their systems through both methods.
The practice of treating monitoring as an essential part of engineering work brings measurable benefits to companies. Durapid’s AI and ML engagements consistently show that clients who implement full-stack monitoring reduce production model failures by 70% within the first quarter. The monitoring principles apply equally to AI systems used in manufacturing deployed in the field.
FAQs
What is the difference between data drift and concept drift in MLOps model monitoring?
Data drift means input distributions change. Concept drift means the relationship between inputs and outputs changed. Both require model retraining but different detection approaches.
How often should I run model monitoring checks in production?
Real-time models need continuous monitoring. Batch models can run drift checks daily or after each batch job completes.
What tools are best for MLOps model monitoring?
Evidently AI, Arize AI, WhyLabs, and Azure ML Model Monitor are the most widely used. MLflow handles model registry and versioning alongside these.
Can machines learn systems monitor themselves automatically?
Yes. Mature MLOps pipelines use automated drift detection and retraining triggers. Human review is still essential for threshold calibration and root cause analysis.
How does the Microsoft MLOps maturity model define monitoring requirements?
Microsoft’s maturity model places automated monitoring and retraining at Level 3 and above. Lower maturity levels rely on manual checks, which are slower and less reliable.
Deepesh Jain
Recent Blog

How Much Does AI Development Cost in 2026? A Complete Guide
March 23, 2026