Microsoft Power BI: A Complete Guide to Features, Benefits, and Use Cases
The present world contains data which exists in all locations. Sales numbers, customer behavior, marketing performance, and operational reports generate information which every team produces every day. The complete narrative remains hidden because raw data by itself does not disclose everything. So businesses require a method that enables them to convert their disorganized information into usable insights which they can implement.
Why Most Companies Struggle With Data?
Most companies collect data. Very few actually use it. A 2024 Gartner report found that over 60% of enterprise data goes unanalyzed, leaving decision-makers relying on gut instinct rather than evidence. Microsoft Power BI directly solves this problem. It turns raw, scattered data into interactive dashboards and reports that anyone on your team can act on without needing a data science background.
The guide will provide an in-depth examination of Microsoft Power BI which includes its main functionalities and advantages. It also covers practical applications. The guide will demonstrate how businesses can implement Microsoft Power BI with their existing enterprise software solutions, including Fixed Assets Management Tool, to build an integrated system that supports data-driven decisions.
What Is Microsoft Power BI and How Does It Work?
Microsoft Power BI is a business intelligence platform that helps organizations make sense of their data and present it in a way people can actually understand. Instead of relying on scattered spreadsheets and manually prepared reports, teams can connect Power BI directly to their data sources. Once the data is connected, it becomes much easier to build interactive dashboards and visual reports that update automatically. The result is simple: less time spent compiling reports and more time spent understanding what the data is really saying.
The process enables teams to transform complex data sets into understandable visual content. From there, they can identify patterns, track progress, and reach their conclusions. Through Microsoft Power BI, organizations can access their data in a more user-friendly way which extends to marketing campaign monitoring through AI Marketing Agents, product development analysis through AI in Product Development, and healthcare data mining through Generative Adversarial Networks.
The system enables organizations to obtain insights which lead to conclusions, then present those through dashboards and reports to their entire workforce. Power BI offers its data analysis functions to all users because its design requires only basic technical skills. Users can create visual reports through a drag-and-drop interface which allows them to add charts, graphs, and tables to their dashboards. Analysts who want to conduct advanced analysis can also use DAX (Data Analysis Expressions) to create their own custom calculations plus metrics.
The Three Main Environments of Power BI
The platform operates through its three main environments which perform various functions. Users build reports and data models in Power BI Desktop, use Power BI Service to share dashboards through the cloud platform, also access Power BI Mobile apps to view insights from any location. The process begins with unprocessed data and concludes with visual insights which teams can use for decision-making.
Core Components of Microsoft Power BI You Should Know
Microsoft Power BI functions as multiple applications which provide users with access to its complete analytics capabilities. The system functions as an integrated suite of tools which together enable users to perform complete analytical processes. Understanding these components helps businesses use the right part of the platform for the right task.
Power BI Desktop serves as the main platform for developing Power BI projects. The Windows application enables users to establish data connections, create data models, develop DAX calculations, and build interactive reports which they can later distribute through online publishing.
Power BI Service enables users to create reports and dashboards which they can subsequently share with others. The team uses scheduled data refreshes to maintain their workflow. They also manage workspace access and report distribution through role-based access control.
Power BI Gateway acts as a secure bridge between on-premises data sources and the Power BI cloud environment. It allows organizations to connect databases such as SQL Server or Oracle to Power BI without exposing their internal systems. This connection ensures that dashboards stay current, either through real-time data updates or scheduled refreshes, so teams can rely on insights that reflect the latest information available.
Power BI Report Server enables companies to manage Power BI reports within their network because it functions as an on-premises solution which needs no cloud access. The solution works best for organizations that must comply with strict data residency regulations, which apply to banking and healthcare activities.
Power BI Embedded and Mobile Applications
Developers can use Power BI Embedded to create interactive dashboards which they can embed into their applications, portals, and websites. The embedded system enables companies to obtain analytics data which they require for developing their AI-based Product Development functions.
Power BI Mobile Apps support Android, iOS, and Windows devices. These applications enable users to access Power BI reports and dashboards which they can use while traveling.
What Is a Power BI Dashboard and Why Does It Matter?
A Power BI dashboard is a single page, often called a canvas, that tells a story through visualizations. A dashboard provides leaders with an instant overview of essential metrics, all from a single page display. Reports, by contrast, need multiple pages to show detailed analysis through their drill-down feature.
The dashboard shows all its visual elements through tiles which display different content. These tiles come from pinned reports that each draw from their own dataset. For example, a user can create a single canvas which contains complete report pages, Excel tiles, images, videos, and Q&A query results.
Dashboards exist exclusively within the Power BI Service. Users have the ability to see dashboards through mobile devices but they cannot create dashboards using Power BI Desktop. Your deployment architecture requires this distinction for proper planning.
Power BI Dashboards vs. Reports: Understanding the Difference
Teams often confuse dashboards with reports. Still, the two systems need to work together because each has its own unique function.
| Feature | Dashboards | Reports |
| Pages | Single page only | One or more pages |
| Data Sources | Can pull from multiple datasets | Single dataset per report |
| Filtering | Cannot filter or slice directly | Full filter, highlight, and slice support |
| Creation Tool | Power BI Service only | Power BI Desktop and Service |
| Use Case | Executive overview, KPI monitoring | Deep analysis, drill-through exploration |
The dashboard presents a complete overview through its selected key elements. Users can view related report details by clicking through from the dashboard tiles. The dashboard functions as a summary while the report presents the complete detailed analysis.
Reports often connect closely with Healthcare Data Mining workflows. Analysts usually need detailed, multi-page drill-down reports to properly explore patient cohorts, diagnoses, and cost centers. Only after this deeper level of analysis can they confidently translate the findings into clear executive dashboards and high-level metrics.
Key Benefits of Using Microsoft Power BI for Enterprise Teams
Organizations often choose Microsoft Power BI because it delivers outcomes that are easy to measure and evaluate. It also works naturally within the broader Microsoft ecosystem, which makes adoption smoother for teams already using Microsoft tools. A Forrester Total Economic Impact study highlighted this impact clearly. Businesses using Power BI reported a 366% return on investment over three years, while also reaching their financial break-even point in less than six months.
Dashboards enable business monitoring by displaying all essential metrics through one unified view. You can display data from multiple datasets or a single one, and share dashboards across your entire organization.
The following aspects serve to differentiate Microsoft Power BI from all other BI platforms in existence:
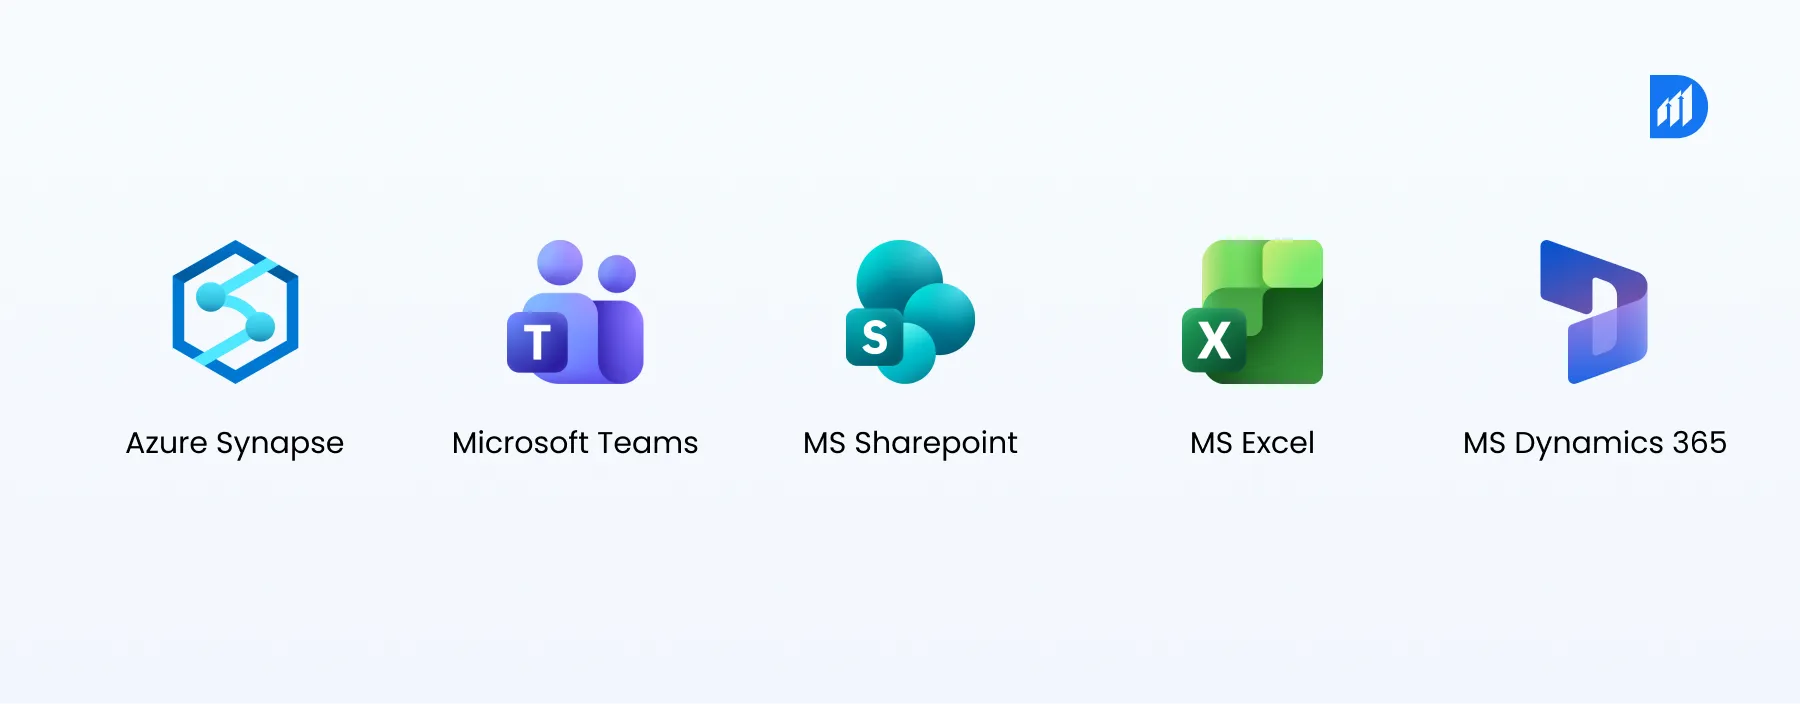
- The system establishes direct connections to Microsoft Azure Synapse, Teams, SharePoint, Excel, and Dynamics 365. This allows users to create data pipelines without needing to construct additional connecting systems.
- Business personnel can create their own reports without waiting for IT assistance. This cuts report delivery time from multiple days to just hours.
- The system shows hidden information through its embedded Smart Narratives, Anomaly Detection, and Q&A natural language query functions which extract data directly from databases.
- Power BI Pro provides an affordable monthly subscription which enables small teams to use its services. Power BI Premium, on the other hand, allows enterprises to operate their systems through dedicated capacity resources.
Microsoft Fabric vs Power BI: A Quick Comparison

When teams start exploring AI in Product Development, one question appears quite often: Microsoft Fabric vs Power BI.
Most teams soon realize the comparison is slightly misleading. Microsoft Fabric is designed as a complete analytics ecosystem. It brings together data engineering, data warehousing, data science, and business intelligence inside one unified platform. Power BI plays a very specific and valuable role within this environment. It becomes the visualization and reporting layer that turns unified data into clear, actionable insights.
This is also why many organizations work with Microsoft Power BI consulting services. The right expertise helps them design meaningful dashboards, structure their data models well, and make the most of both Fabric and Power BI working together.
Real-World Use Cases Across Industries
Microsoft Power BI delivers value across nearly every vertical. The following list includes the most typical business applications which produce observable business outcomes.
Finance
The numerical data requires visual clarity to reveal its complete narrative. Microsoft Power BI enables finance teams to monitor business operations without waiting for extended reporting periods. From a single dashboard, CFOs can monitor revenue, gross profit, net margin, and budget variance across multiple subsidiaries. The system also enables finance teams to acquire immediate financial data because it automatically combines multiple spreadsheets which used to take several days to process.
Healthcare
Hospitals operate through an ongoing stream of data that involves patient movements, equipment, lab operations, and hospital functions. Power BI brings this information into a single dashboard where teams can track patient throughput, waiting times, lab efficiency, and readmission patterns. The system displays medical equipment usage across departments when it connects with hospital asset tracking software. This visibility helps hospitals reduce equipment downtime and ensure critical assets are available when needed.
Retail and E-commerce
Retail teams make product, inventory, and sales performance decisions through their daily work. Power BI helps them see what is actually happening across stores and regions. Merchandising teams can, for example, track product sell-through rates, stockout levels, and regional sales trends through live dashboards. Power BI enables automatic order and inventory data transfer into reports because it connects directly with Shopify, SAP, even Dynamics 365.
HR Analytics
People data often sits scattered across multiple spreadsheets, making it difficult to see meaningful patterns. Power BI helps HR leaders bring that information together. Teams can track employee headcount, turnover trends, hiring metrics, and performance data in one place. The dashboards can be filtered by department, tenure, or location. This gives HR teams a clearer view of workforce trends without spending hours every week updating spreadsheets.
Manufacturing
Plant managers use real-time monitoring to track OEE (Overall Equipment Effectiveness), defect rates, and the reasons for equipment downtime. This technology provides organizations with smart process insights which enable their business processes to function at full capacity.
When to Use Microsoft Power BI and When Not To?
Microsoft Power BI works best when your data volume is manageable, your team already uses Microsoft 365 or Azure, plus when your primary goal is reporting and visualization rather than data engineering.
Scenarios Where Power BI Fits Best
Use Power BI when:
- You need interactive dashboards for business stakeholders with no coding requirement
- Your data exists in Azure, SQL Server, SharePoint, or Excel
- You want to pursue the Microsoft Certified: Power BI Data Analyst Associate credential to validate team skills
- You require embedded analytics capabilities within a custom application
Consider alternatives when:
- Your use case requires heavy real-time stream processing at millisecond latency (Apache Kafka + Flink suits this better)
- You need a complete data science and MLOps system (Azure Machine Learning or Databricks is more suitable)
- Your data volumes exceed hundreds of millions of rows without a premium or Fabric capacity backing
Organizations that seek Microsoft Power BI Consulting Services need to understand their boundary. This knowledge will enable them to select appropriate architectural solutions from the start, instead of making adjustments later.
How Durapid Helps Organizations Get Maximum Value from Power BI?
Durapid Technologies employs more than 150 Microsoft-certified experts and over 95 Databricks-certified specialists. Our teams create complete Power BI solutions that include data modeling in Azure Synapse plus dashboard delivery in Power BI Service for financial services, healthcare, retail, and manufacturing industries.
Our organization provides structured programs which enable teams to develop their skills according to the Microsoft Learn Power BI course path. We also support Microsoft learning Power BI at every experience level. This ensures your internal team can maintain and manage reports independently after go-live.
Durapid designs its Microsoft Power BI Consulting Services according to your business requirements. Whether you need to switch from outdated reporting systems, create your first enterprise dashboard, or implement Power BI in your advanced AI pipeline, we can help.
Frequently Asked Questions
What functions does Microsoft Power BI provide to users?
Microsoft Power BI enables users to connect with data sources and create interactive reports. It also lets users distribute dashboards which assist teams in tracking KPIs and making speedy decisions based on data analysis.
What distinguishes Microsoft Fabric vs Power BI?
Microsoft Fabric operates as a complete analytics solution which combines data engineering, data warehousing, and real-time analytics capabilities. Power BI functions as the graphical interface of Fabric which users employ to create reports and display dashboards.
Is it beneficial to pursue the Microsoft Certified: Power BI Data Analyst Associate certification?
The credential proves your expertise in designing data models and developing DAX measures while creating reports in Power BI Service, which makes it a valuable asset for data and BI professional roles.
Can Power BI connect to non-Microsoft data sources?
Power BI enables users to connect with more than 100 data sources which include Google Analytics, Salesforce, Snowflake, MySQL, SAP, and REST APIs through its built-in connectors and Power Query editor.
What is the difference between a Power BI dashboard and a report?
A dashboard is a single-page canvas that aggregates tiles from multiple reports for a high-level view. A report is a multi-page document which connects to one dataset and enables users to conduct in-depth analysis through drill-down methods.
Deepesh Jain
Recent Blog

Top 10 AI Agent Tools: Features, Pros, Cons & Comparison
March 9, 2026